Sensors
The sensors screen manages the fleet of LoRaWAN devices that collect telemetry from your assets. Every sensor runs a device profile (the vendor/model registry row carrying its metric-map codec), and reports its battery level and radio signal with each uplink.
What you see
Section titled “What you see”Fleet table
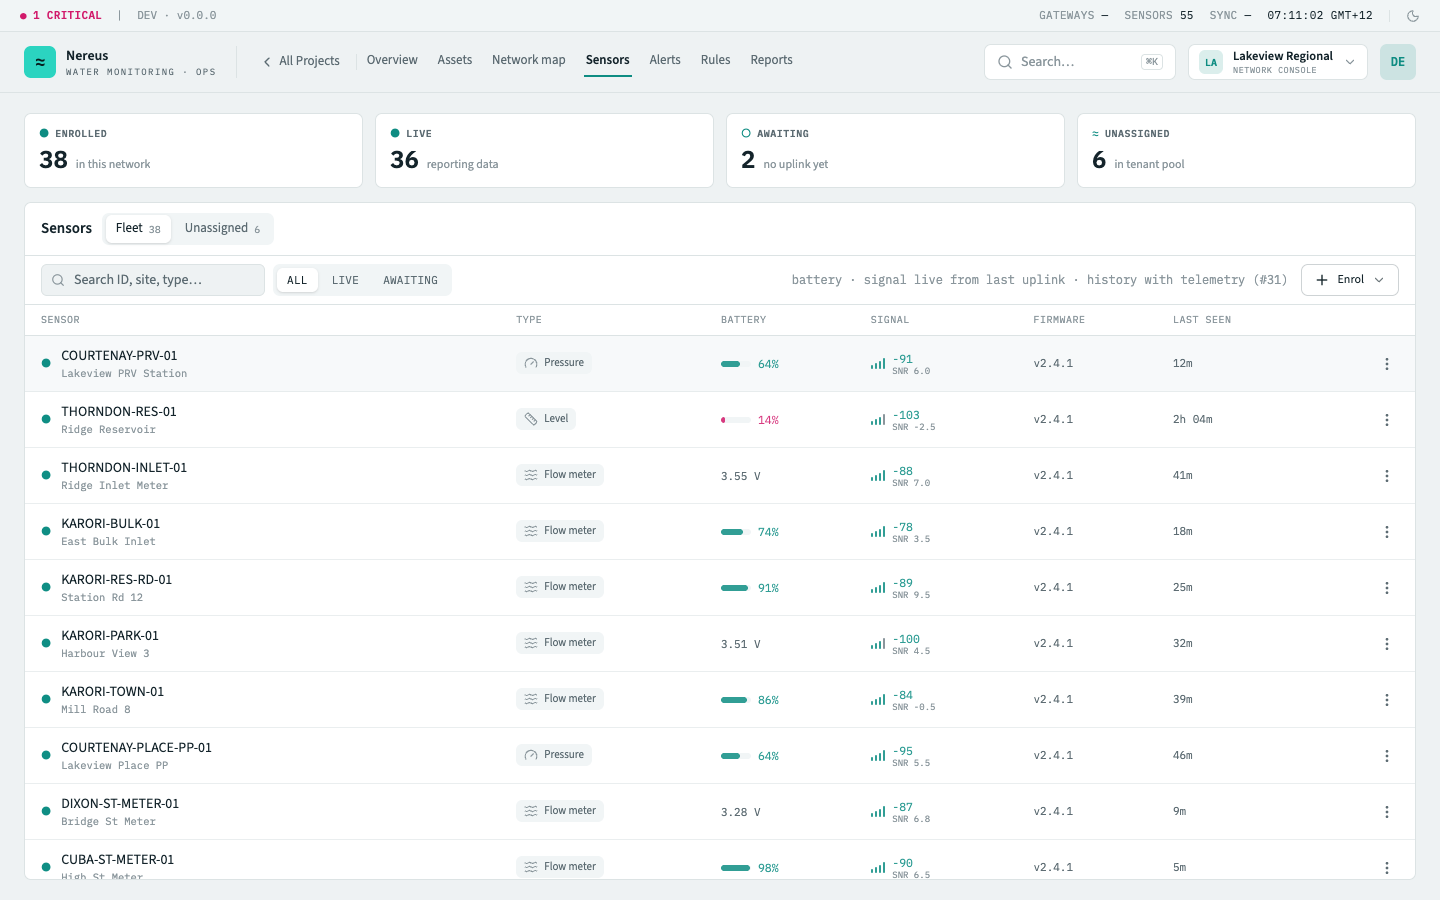
Section titled “Fleet table”A table listing every sensor with columns for the sensor (label + site), type, battery, signal, firmware, and last seen. Stat cards above it summarise the fleet — Enrolled, Live (“reporting data”), Awaiting (“no uplink yet”), and Unassigned (“in tenant pool”) — and a toolbar filter narrows the table to All / Live / Awaiting. A sensor is live once its first uplink lands; until then it sits under Awaiting with a last‑seen of Never.
The battery and signal columns show live device health — critical resources for field maintenance planning:
The header health chip grades each sensor Online / Degraded / Offline from its last-seen time,
battery, and signal (the shared classifier in packages/domain/src/telemetry/Freshness.ts):
| Signal | Healthy | Degraded (warn) | Critical |
|---|---|---|---|
| Battery (%) | ≥ 30% | 15–30% | < 15% |
| RSSI (dBm) | > –113 | ≤ –113 | — |
| Freshness | last uplink < 6 h ago | — | Offline at ≥ 6 h, or never seen |
Freshness outranks everything: a sensor with no uplink for six hours (or none ever) reads Offline regardless of its last battery or signal. Below that, a critically low battery (< 15%) is Critical; a low battery (< 30%) or weak signal (≤ –113 dBm) is Degraded. Battery is only graded when reported as a percentage — a raw voltage has no 0–100 scale to threshold against.
Sensor detail
Section titled “Sensor detail”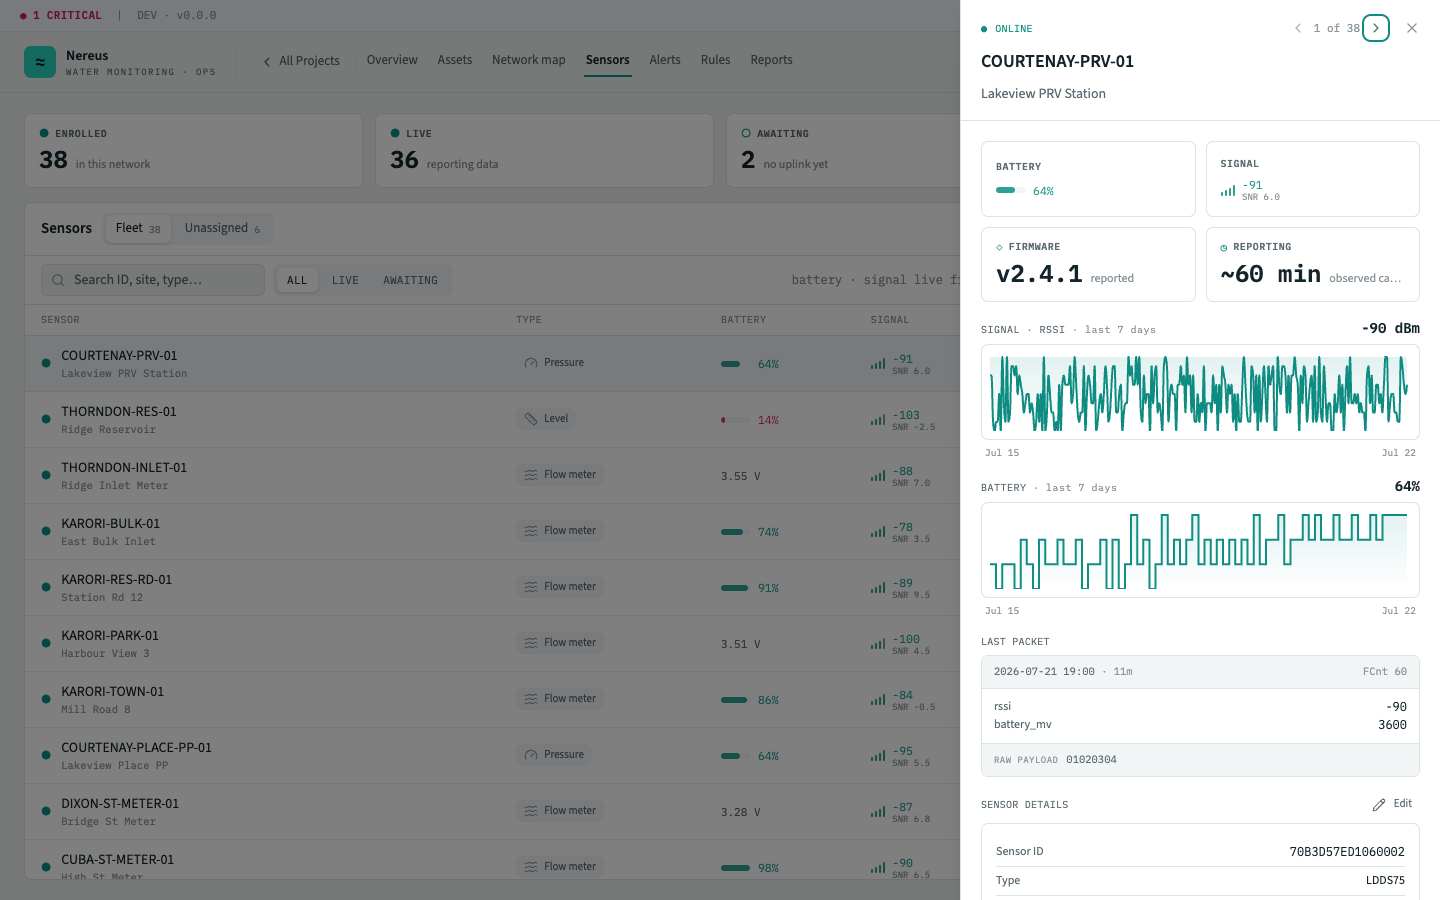
Click any sensor row to open the sensor detail sheet — a right-side panel with tabs for telemetry history (time-series charts per metric), uplink log (raw payloads with decoded values), metadata (device profile, installed asset, activation date), and a health chart showing battery level and SNR over the last 30 days.
Device profiles
Section titled “Device profiles”Every sensor runs a device profile — a registry row keyed by vendor and model that carries
the metric map: the codec mapping each raw decoded-payload field to a canonical metric key (and a
unit scale). That map is the whole profile; it’s how one sensor’s batt and another’s
battery_percent both land on battery_v. Reporting cadence is not a profile field — it’s
observed from the sensor’s own uplink history (the median gap between uplinks), so a profile you pick
in the enrol dialog is identified by its vendor/model and the metrics it decodes.
Key interactions
Section titled “Key interactions”Enrol a sensor — opens the enrol dialog. Paste one or more DevEUIs (per-line or comma-separated), select a device profile from the picker, choose the asset the sensor is installed on (or leave unassigned), and optionally add a label. Click Enrol and each DevEUI is provisioned.
Edit label / reassign asset — from the sensor detail sheet’s inline edit controls.
Bulk actions — select rows via the table checkbox column, then choose Assign profile (bulk change the device profile) or Assign asset (bulk move sensors between assets).
View uplink log — the uplink log tab shows every raw payload in reverse chronological order. Click any row to see the decoded JSON payload side by side with the raw hex bytes.
Related
Section titled “Related”- Assets — where sensors are installed
- Project overview — sensor health stats in the network health strip
- Alerts — alert rules that trigger from sensor telemetry