Assets
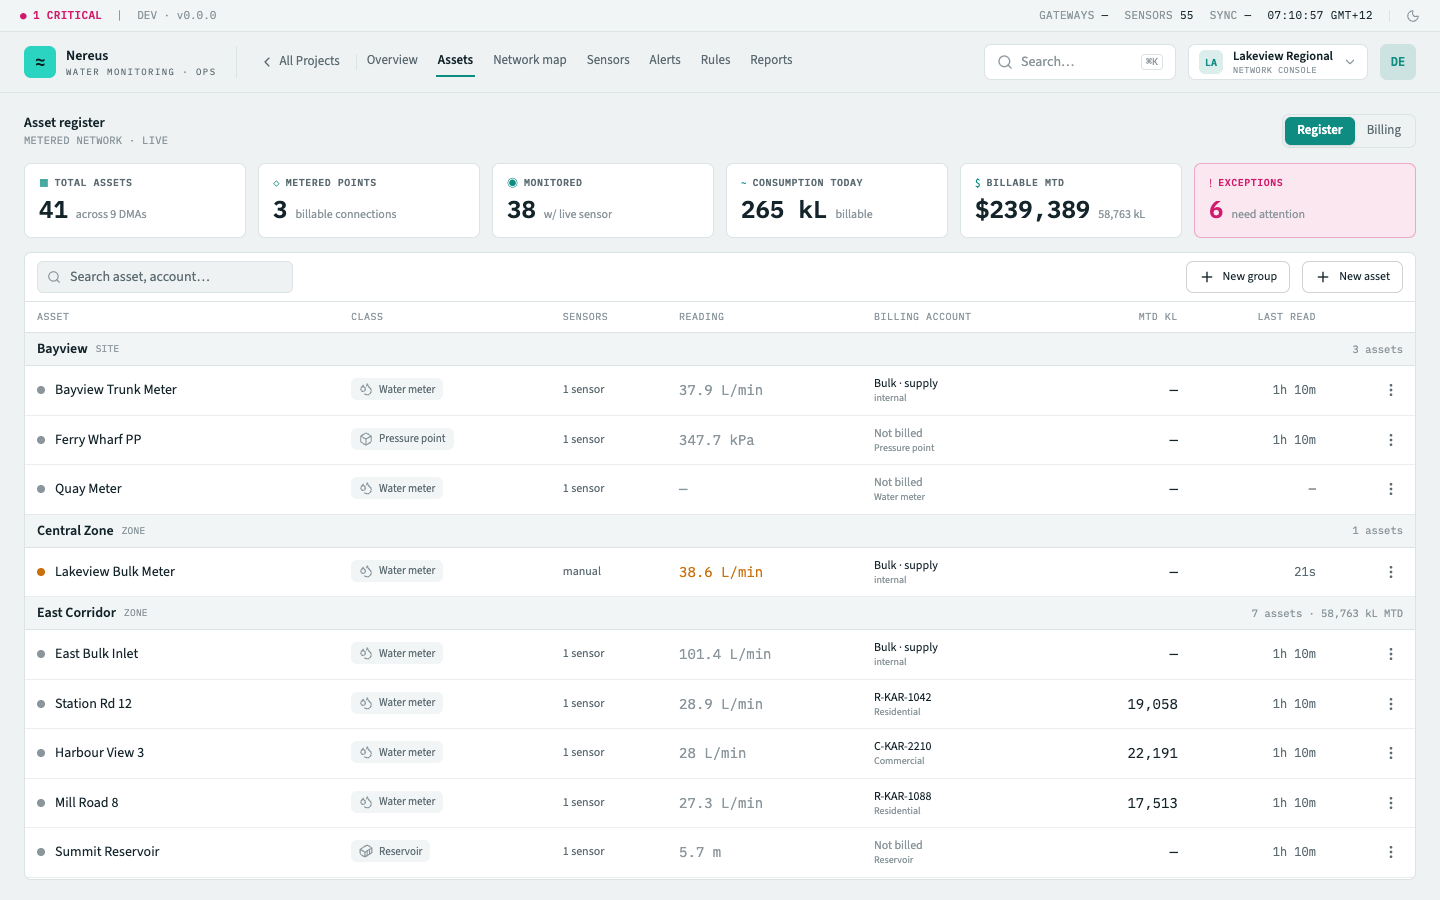
The assets screen is the inventory of everything under monitoring — reservoirs, pump stations, water meters, and pressure points. Each asset belongs to a group and has an asset class that determines its icon, metric catalogue, and geospatial presentation.
What you see
Section titled “What you see”Asset register
Section titled “Asset register”A paginated table with columns for name, type, group, location, and status. The search bar filters across name, type, and group. Click any column header to sort.
Every asset is one of four asset classes, shown as colour-coded chips with an icon:
| Asset class | Typical metrics | Map icon |
|---|---|---|
| Water meter | Flow rate (m³/h), cumulative volume (m³) | Filled circle |
| Pump station | Pressure (kPa), pump status | Cog |
| Reservoir | Level (m, %), volume (m³) | Filled droplet |
| Pressure point | Pressure (kPa) | Triangle |
See Assets & groups for each class’s full attribute schema.
Groups
Section titled “Groups”Groups organise assets into a geographic region → zone → site tree (e.g. “North Basin” → “Central Zone” → “Lakeview”). The tree sidebar on the left shows the group hierarchy. Click a group to filter the register to only that group’s assets.
Groups nest up to three levels. Refresh asset tree in the group panel side menu forces a re-fetch of the hierarchy.
Asset detail sheet
Section titled “Asset detail sheet”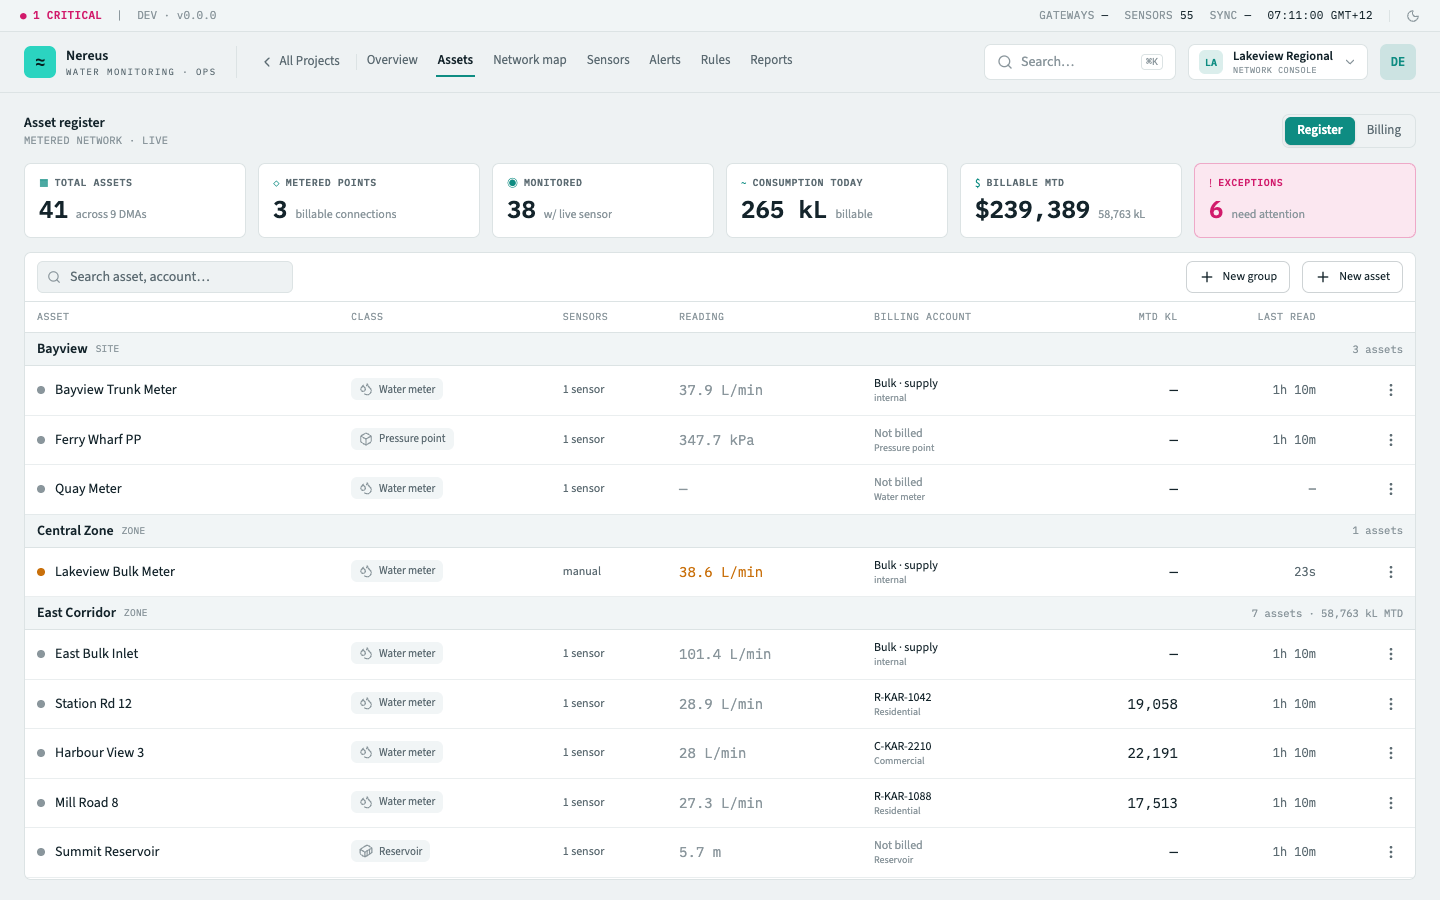
Click any asset row or map pin to open the detail sheet — a right-side panel with tabs for telemetry, sensor list, documents, and activity log. The telemetry tab shows the asset’s most recent readings and a trend chart for each metric. The sensor tab lists every sensor installed on the asset with its device profile, battery level, and signal strength.
Key interactions
Section titled “Key interactions”Add asset — opens a form sheet. Enter a name, select a type and group, and optionally specify a location via the map picker or by entering coordinates.
Edit asset — inline editing on the detail sheet: name, location (drag the map pin), and custom attributes (full-scale capacity values, metadata).
Delete asset — from the detail sheet’s overflow menu. Prompts confirmation because deletion cascades to all sensors and telemetry associated with the asset.
Export CSV — downloads the visible table columns (current filter and sort order) as a CSV file.
Related
Section titled “Related”- Sensors — the devices installed on each asset
- Alerts — how asset status feeds into alert rules
- Project overview — where asset health is summarised