Reports
The reports screen is the hub for building, scheduling, and exporting reports — compliance documents, operational summaries, and custom CSV exports. Each report is generated from a template that defines its structure, metrics, and time range.
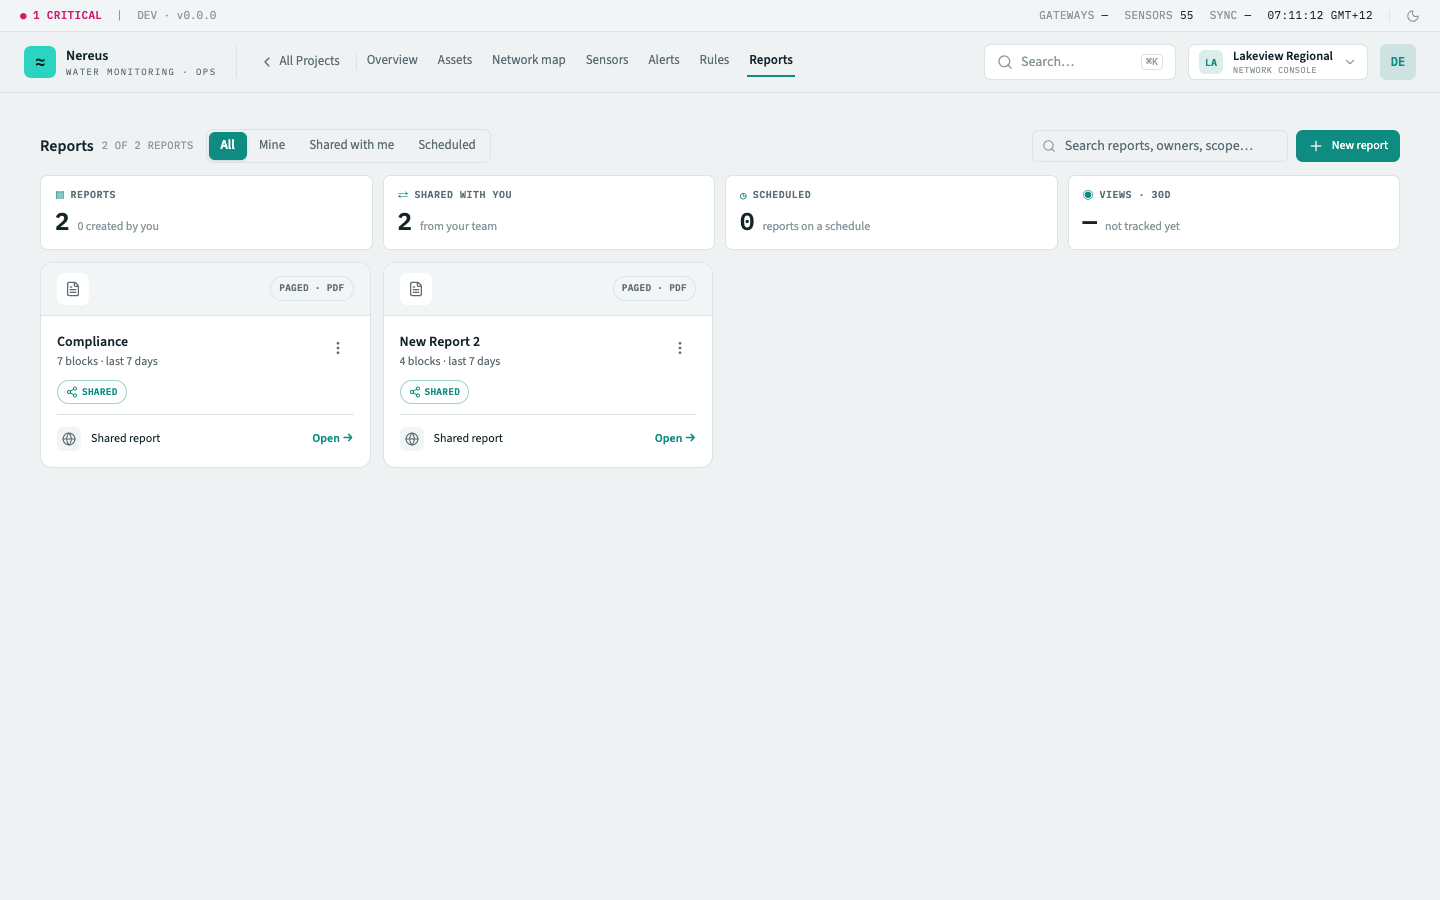
What you see
Section titled “What you see”Report list
Section titled “Report list”A paginated table of all reports — both generated documents and scheduled configurations. Columns: title, template, last generated, schedule (if recurring), and status (draft / scheduled / generated / error). The search bar filters by title and template name.
Report KPIs
Section titled “Report KPIs”The top of each generated report shows a row of key performance indicators — the same widgets you configure on dashboards, locked to the report’s time range:
Template gallery
Section titled “Template gallery”Switch to the Templates tab to start a report from a template. There are two kinds — paged reports (multi-page documents built from blocks) and extracts (a tabular query you can export to CSV).
Paged report templates:
| Template | Purpose |
|---|---|
| Weekly network summary | Cover, KPIs, fleet health, a trend and per-site readings across three pages |
| Compliance report | Threshold adherence with per-asset breach status, exceedance detail, and notes |
| Billing statement | Current-cycle metered consumption and charges — network totals and the per-asset register |
| Site health report | Sensor fleet condition, reservoir levels, and per-site readings |
| Blank | Start with just a report header and build it up block by block |
Extract templates:
| Template | Purpose |
|---|---|
| Compliance export | Daily reservoir levels against a minimum threshold, with breach status per reading |
| Raw readings extract | Hourly pressure readings per site — the full time series, no thresholds |
| Blank extract | Start from an empty query and choose your own scope, metric, and columns |
Report builder
Section titled “Report builder”New report opens the builder: pick a template, then configure its scope and time range. Extracts additionally let you choose the metric, bucket, and which columns to include; a source toggle flips an extract between telemetry and billing data.
Scheduling & delivery
Section titled “Scheduling & delivery”A saved report can carry a delivery schedule that regenerates it on a cadence and emails the fresh copy out — so a weekly compliance report lands in inboxes every Monday without anyone opening Nereus. Reports carrying a schedule appear under the Scheduled filter, with a count on the facet.
A schedule has three parts:
- Cadence — daily, weekly (on a chosen day of the week), or monthly (on a day of the month, 1–28 so it exists in every month), at a set hour and minute. Scheduled times are in UTC, so pick the slot with that in mind. Nereus derives the next run from the cadence and sweeps due schedules roughly once a minute.
- Recipients — an explicit list of email addresses (at least one). This is purely a delivery list: the addresses don’t need Nereus accounts, and being on it grants no access to anything.
- Run-as principal — the schedule renders as a designated member (the creator by default). The report sees exactly what that person can see, so scheduled output can’t leak beyond their access. If that member later leaves or is suspended, the schedule auto-disables with a reason rather than running with stale privileges — re-point it at an active member to resume.
Each run renders the report and delivers it as an email with the PDF attached, showing the reporting period and file size.
Key interactions
Section titled “Key interactions”Generate — runs the template against the configured time range and generates a PDF report. The PDF appears in the list with a Download button. Pre-scheduled reports generate automatically at the configured cadence.
Schedule — give a paged report a delivery schedule (cadence, recipients, run-as principal) so it regenerates and is emailed out automatically. See Scheduling & delivery above for how each part works.
Refresh preview — re-runs the template against live data without saving or scheduling — useful for tuning a report before committing a schedule.
Delete — removes a report permanently. Scheduled configurations show a confirmation prompt with the schedule details.
Related
Section titled “Related”- Project overview — dashboard widgets share the same metric catalogue
- Alerts — alert rules as inputs for operational and incident reports
- How to build a report